The Effects of Diversification aka Keeping An Eye on the Big Picture
MODERNIST’S ASSET CLASS INVESTING PORTFOLIOS ARE STRATEGICALLY INVESTED WITH A FOCUS ON LONG-TERM PERFORMANCE OBJECTIVES. PORTFOLIO ALLOCATIONS AND INVESTMENTS ARE NOT ADJUSTED IN RESPONSE TO MARKET NEWS OR ECONOMIC EVENTS; HOWEVER, OUR INVESTMENT COMMITTEE EVALUATES AND REPORTS ON MARKET AND ECONOMIC CONDITIONS TO PROVIDE OUR INVESTORS WITH PERSPECTIVE AND TO PUT PORTFOLIO PERFORMANCE IN PROPER CONTEXT.
Phew! Financial news and markets have been a lot in 2023! While there’s been a steady beat of negative chatter about how the market fared in 2022, we always aim to add historical context to remind us all of the bigger picture.
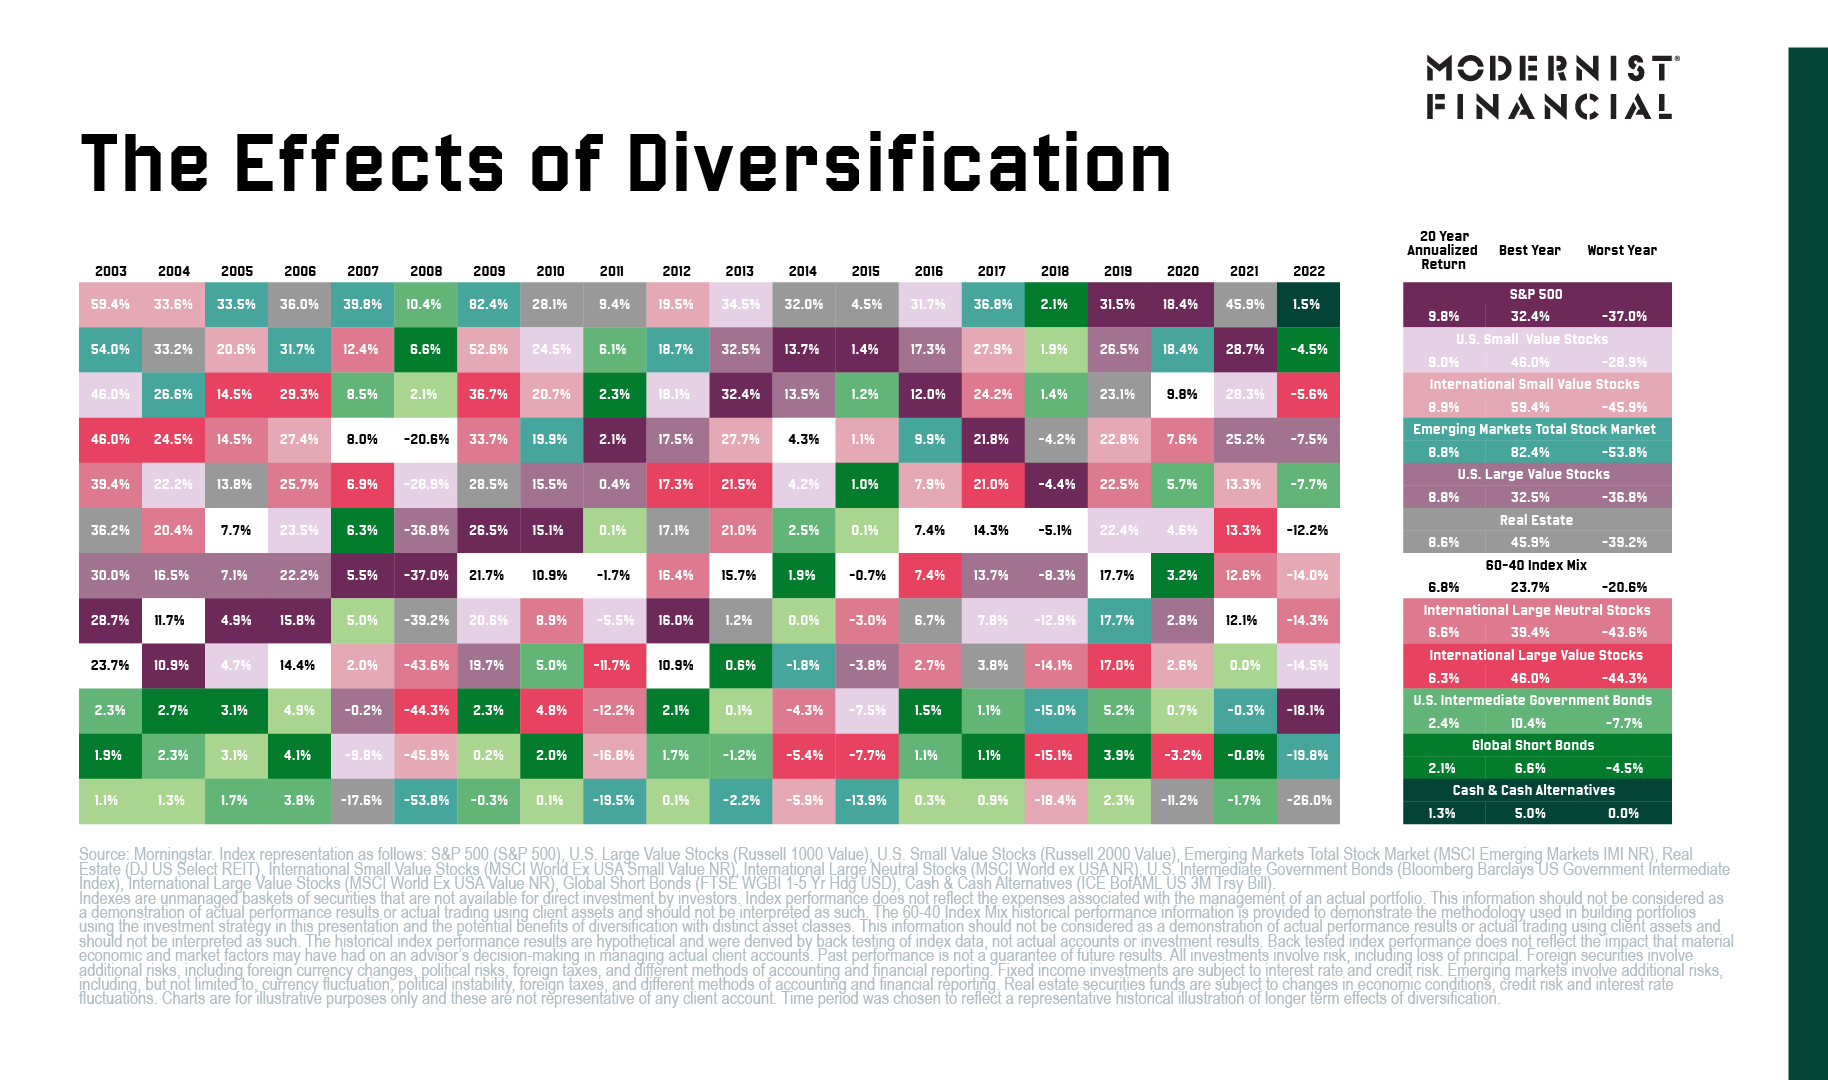
This year in Strategy Review meetings, we’re talking with clients about one of our favorite financial charts…CHeck it out!
We call this a “skittles chart” for some pretty obvious reasons, as it shows the random distribution of colors (aka asset class performance) over the past 20 years. Here’s how to read this chart:
Each color on the chart represents a different asset class in Modernist’s global portfolios.
The far-right column shows the 20 year annualized return. Hint: These are the return and risk numbers we care most about, as shorter time periods tend to be waaaaaaay too noisy to be particularly helpful for planning purposes.
Starting at the far-left, you’ll see the annual performance of each asset class from 2003 to 2022.
Here are some of the questions we’re discussing with our clients:
As you look at this chart, what do you notice about how the following performed over the years?
S&P 500
2. Cash
3. Real Estate
4. What do you notice about performance in 2008? How did the green colors (bonds) perform that year? How about the subsequent 5 years?
5. What about performance in 2022? How did the green colors (bonds) perform that year? How about the previous 4 years?
6. Check out the white boxes. That’s our model global portfolio when it’s allocated to 60% stock and 40% bonds (a portfolio many of our older retired clients own). What do you notice about its performance over the past 20 years?
We hope this insight into how we work with our clients to empower and educate them helped you understand markets better, too!
xo,


